

AI made content faster. I made design keep up.
The Challenge
Every figure was two jobs, not one.
Both had to be exact. The data because it's math, the style because each state has its own conventions and students should see the same figures in our materials that they'll see on their exam. So designers did both, by hand, on every math and science figure. AI can't do either one well enough yet.
When AI sped up content development, doing both jobs on every figure is what held design back. How might we take one job off the designer's plate, so they can do the other one well?
Overview
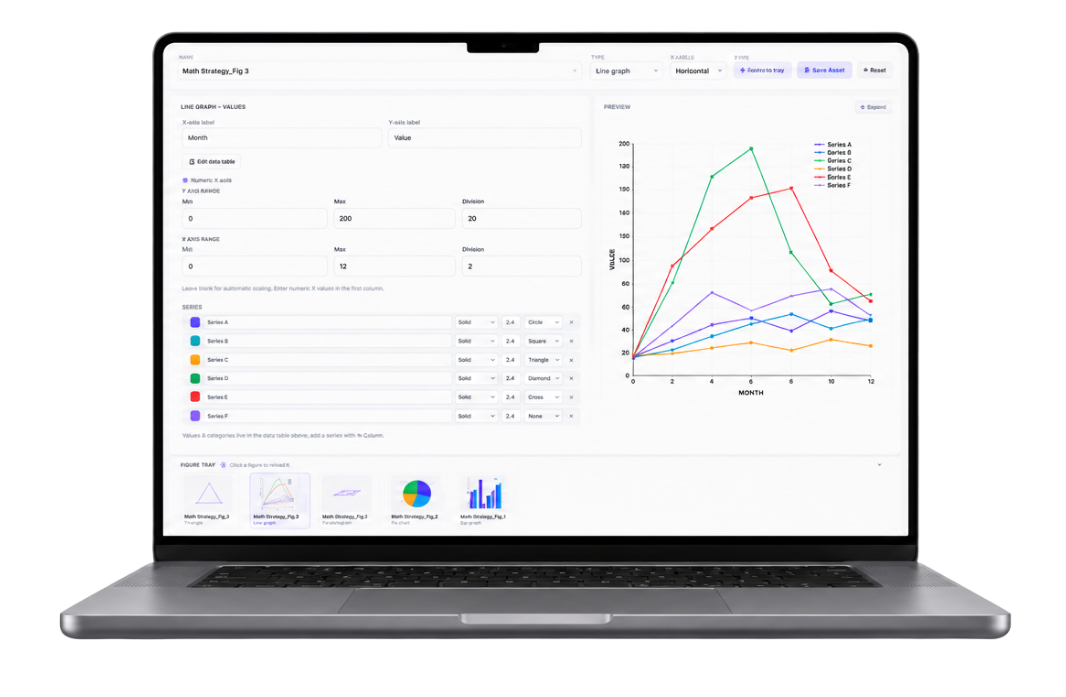
I built a graphing tool into the authoring platform. Content developers make their own figures and export them as SVGs, and design gets them already plotted, so we're editing for style instead of rebuilding the data. I built it with Claude Code and ship it as a contributing engineer on the repo.
TIMELINE
8 weeks to deploy
MasteryPrep
ROLE
Sole developer
built with Claude Code
USERS
8 content developers
internal authoring team
IMPACT
Reduce asset creation a
above the 68 industry benchmark
Approach
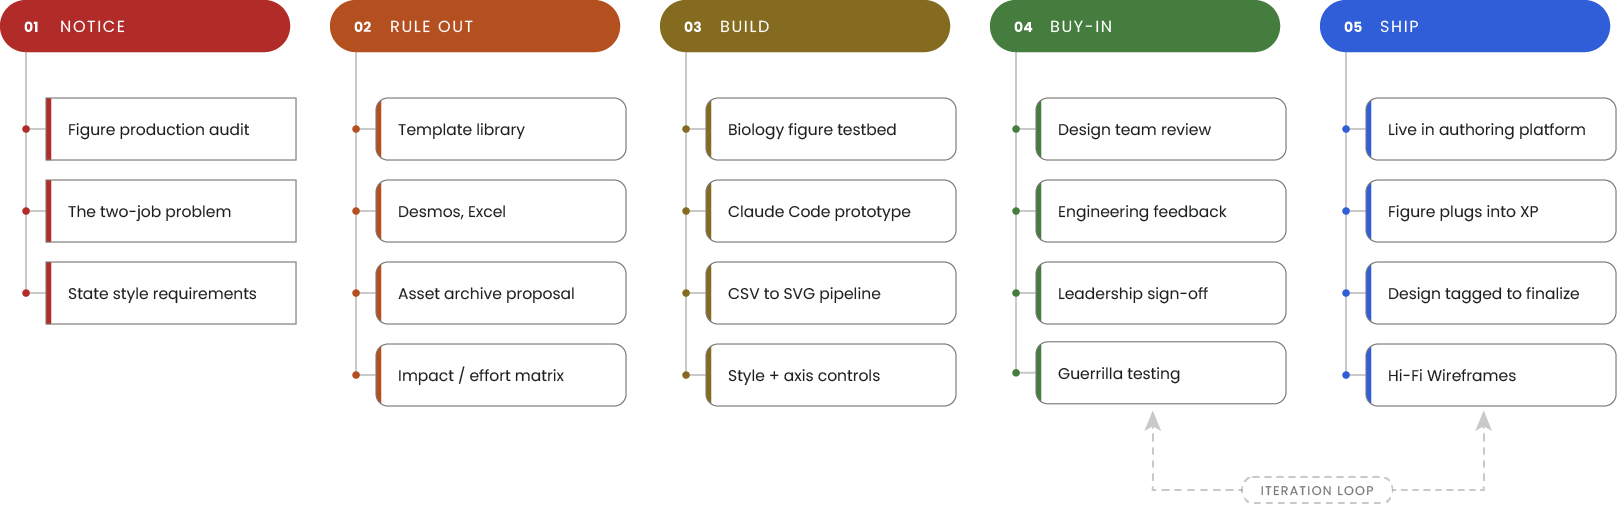
I built the first version against a real set of biology figures, so every setting came from something I'd had to redo by hand: axis increments, stroke and tick styles, point shapes, rotated axis titles. One month to build with Claude Code, two more to get buy-in from design, engineering, and academic products. It ships as its own entity, so content developers plot and export, then tag design to finalize.
Notice
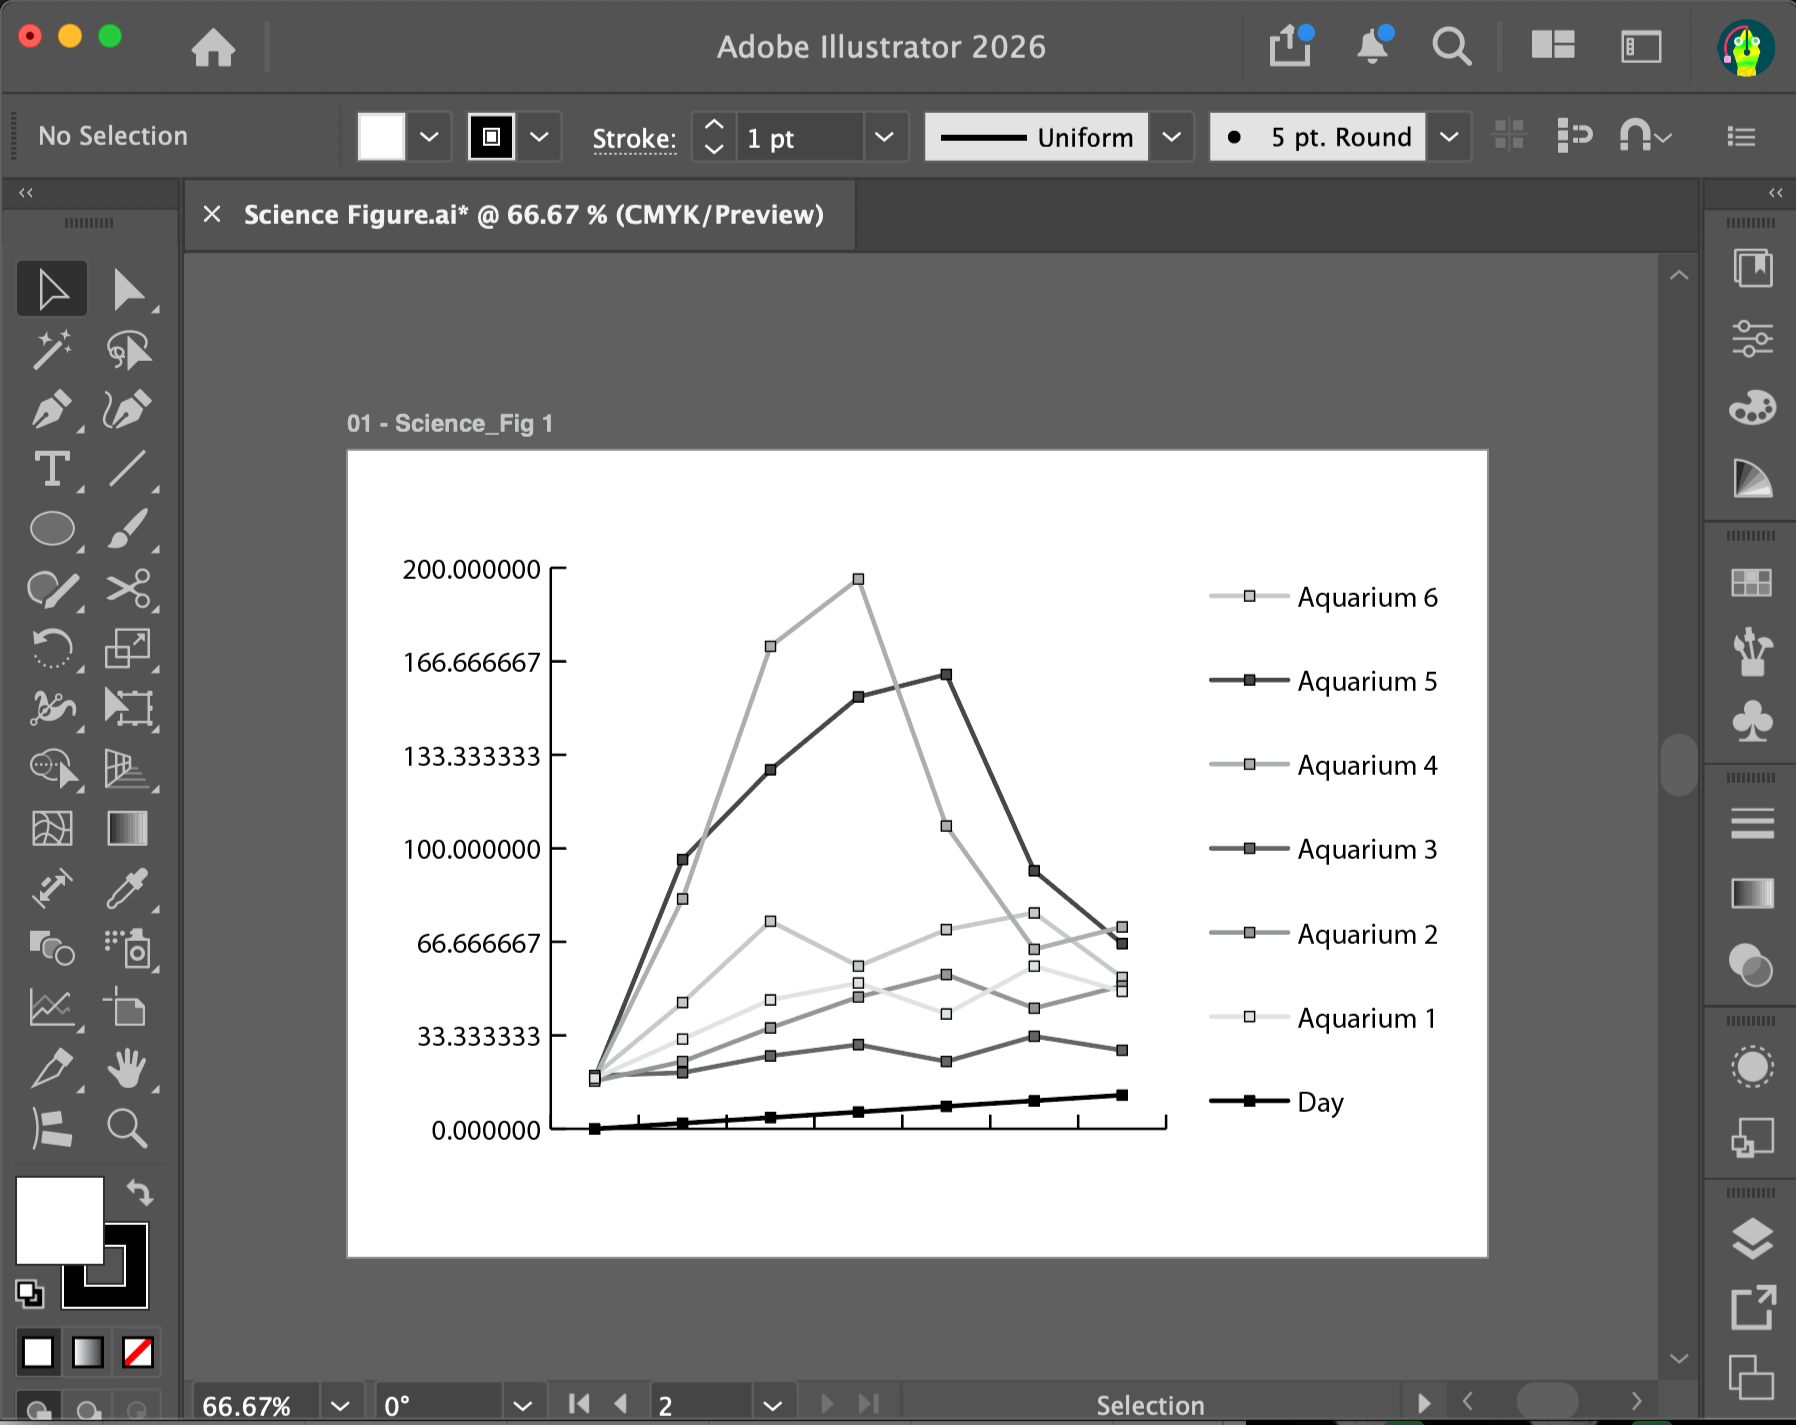
I was designing an asset one day and I noticed I was spending way to mych time creating it. And the reason that is becsue adobe figure creation tool is not intuative as excel or spreadsheets. Theres is alot of manual labor that goes into perfecting our assets.
Rule Out
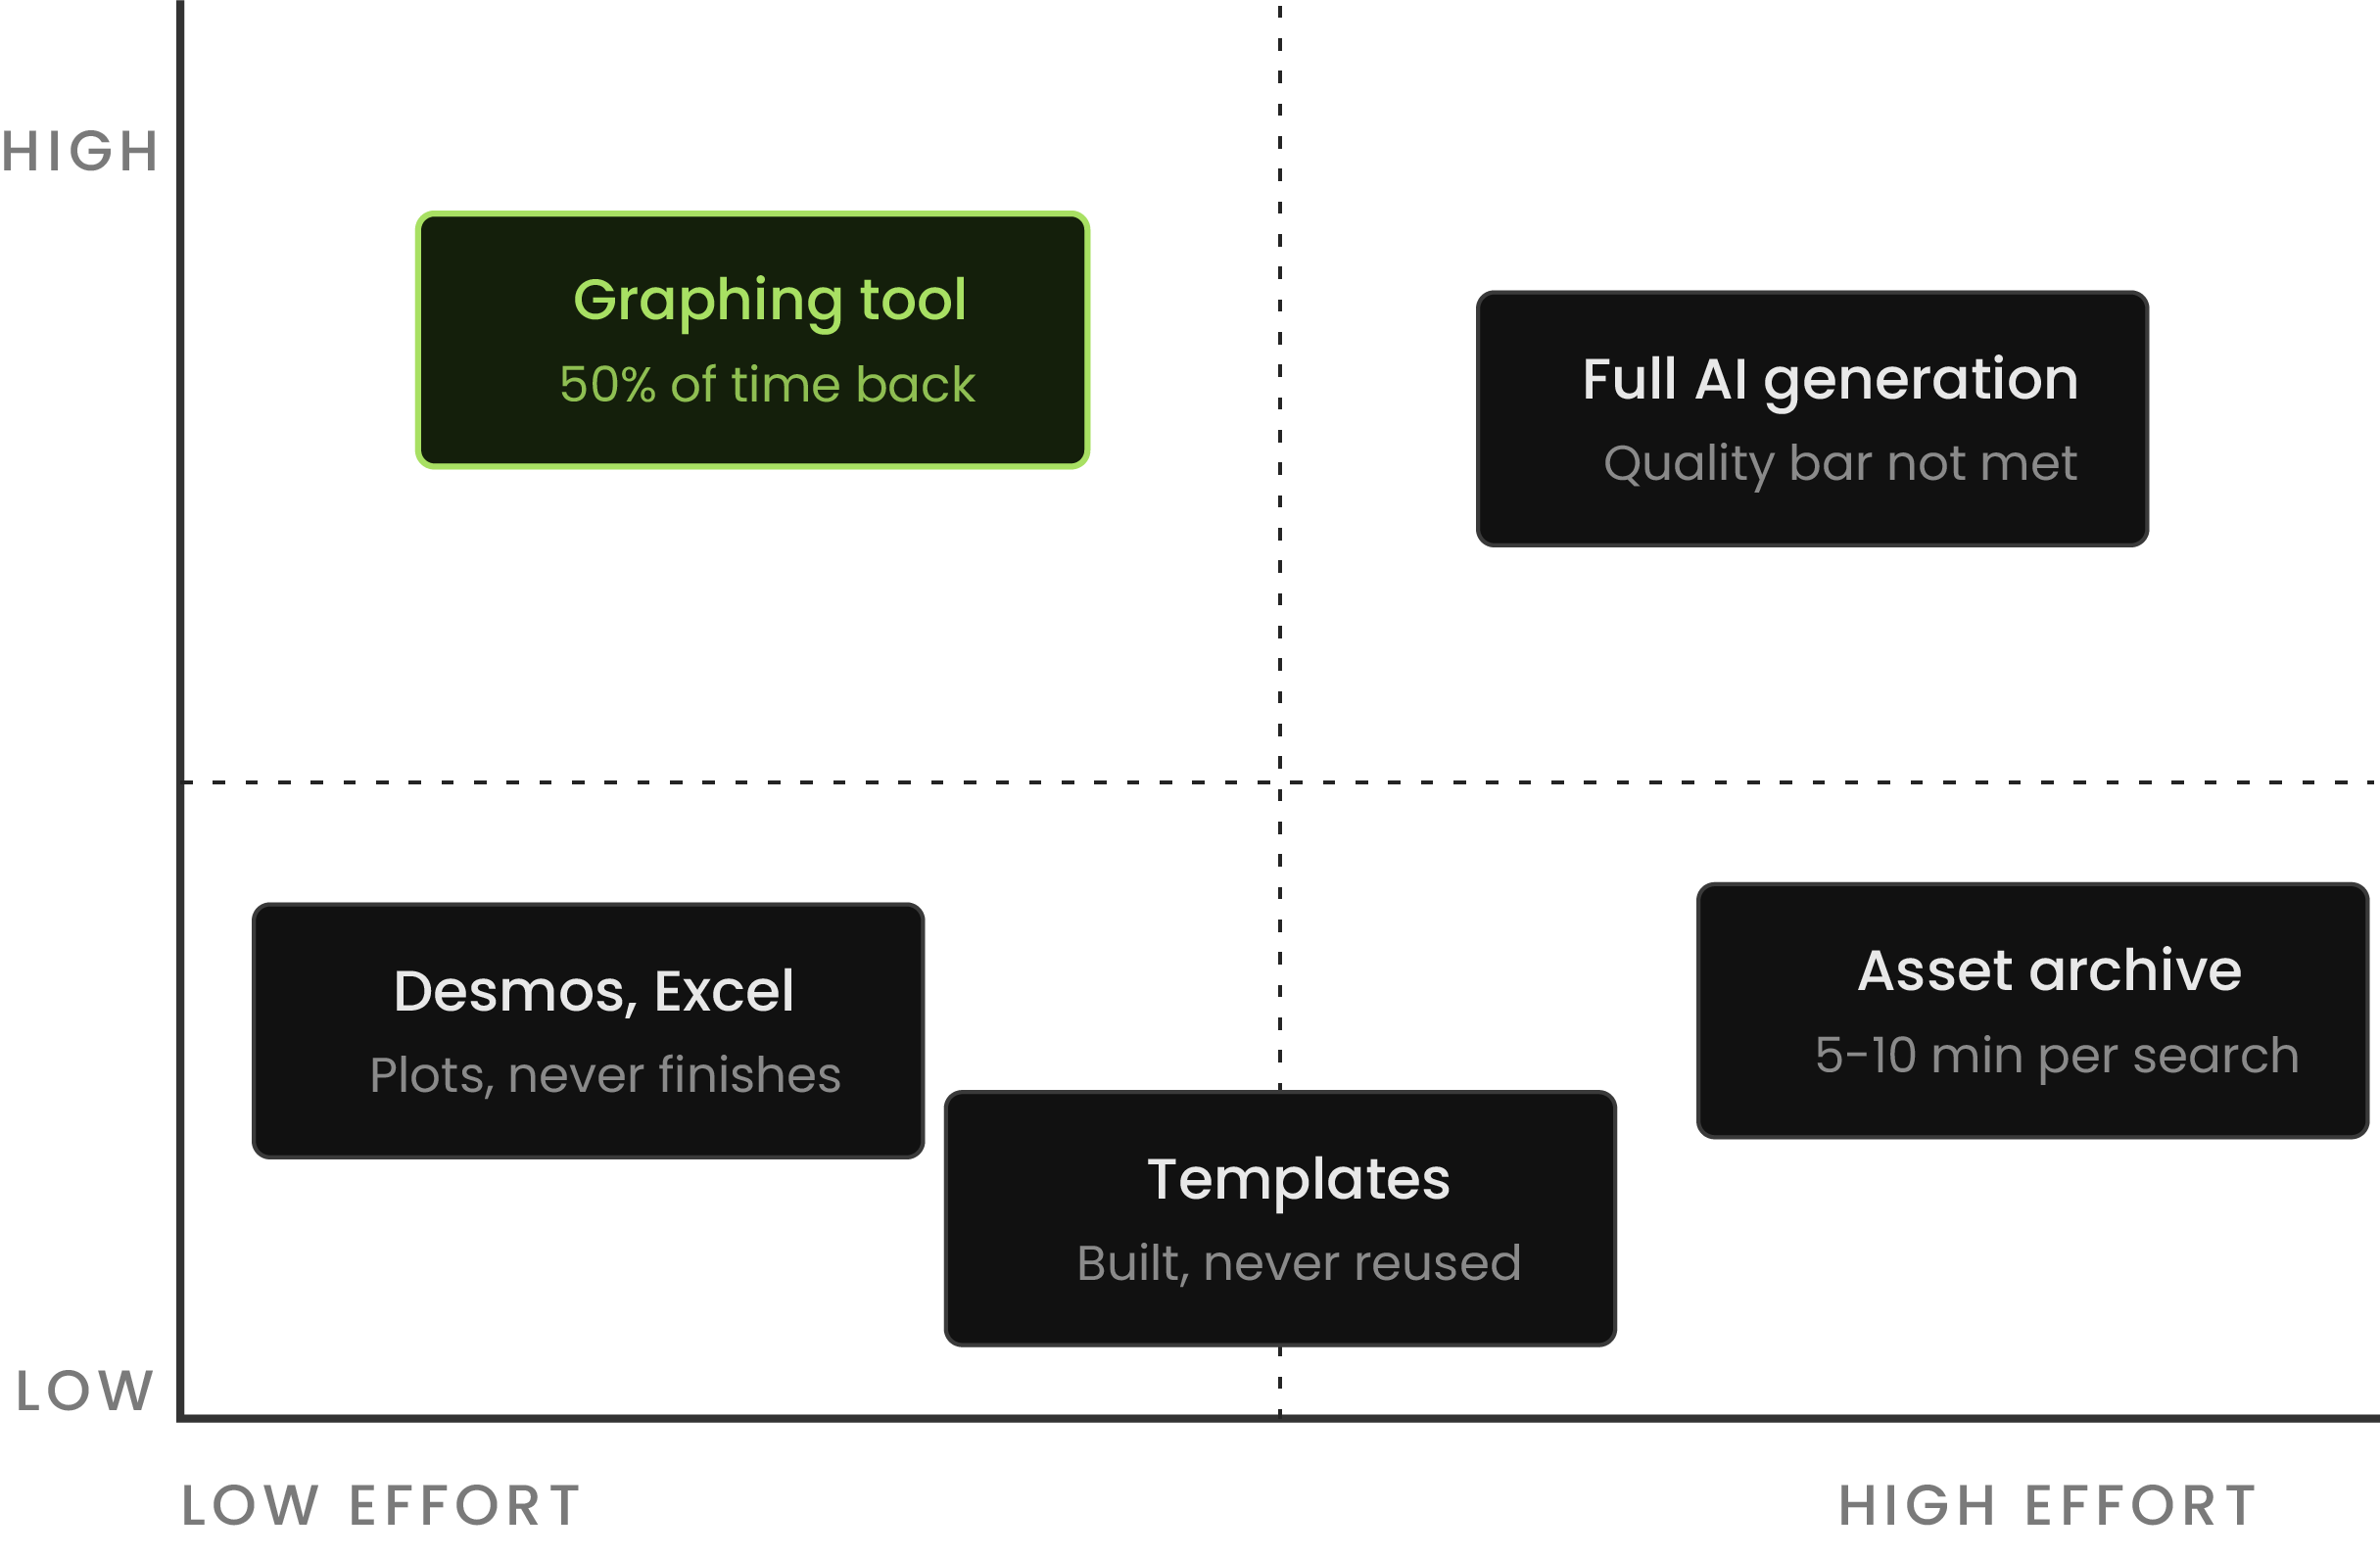
Design capacity when it comes to figures has always been an ongoing conversation and it only seem to get noticed when design was aleady drowing in assets. Before piovtign to my solution I effort mattrix to understand the trade off for solutions we though of in the past.
The Build
Plotting Points made simple using a CSV file
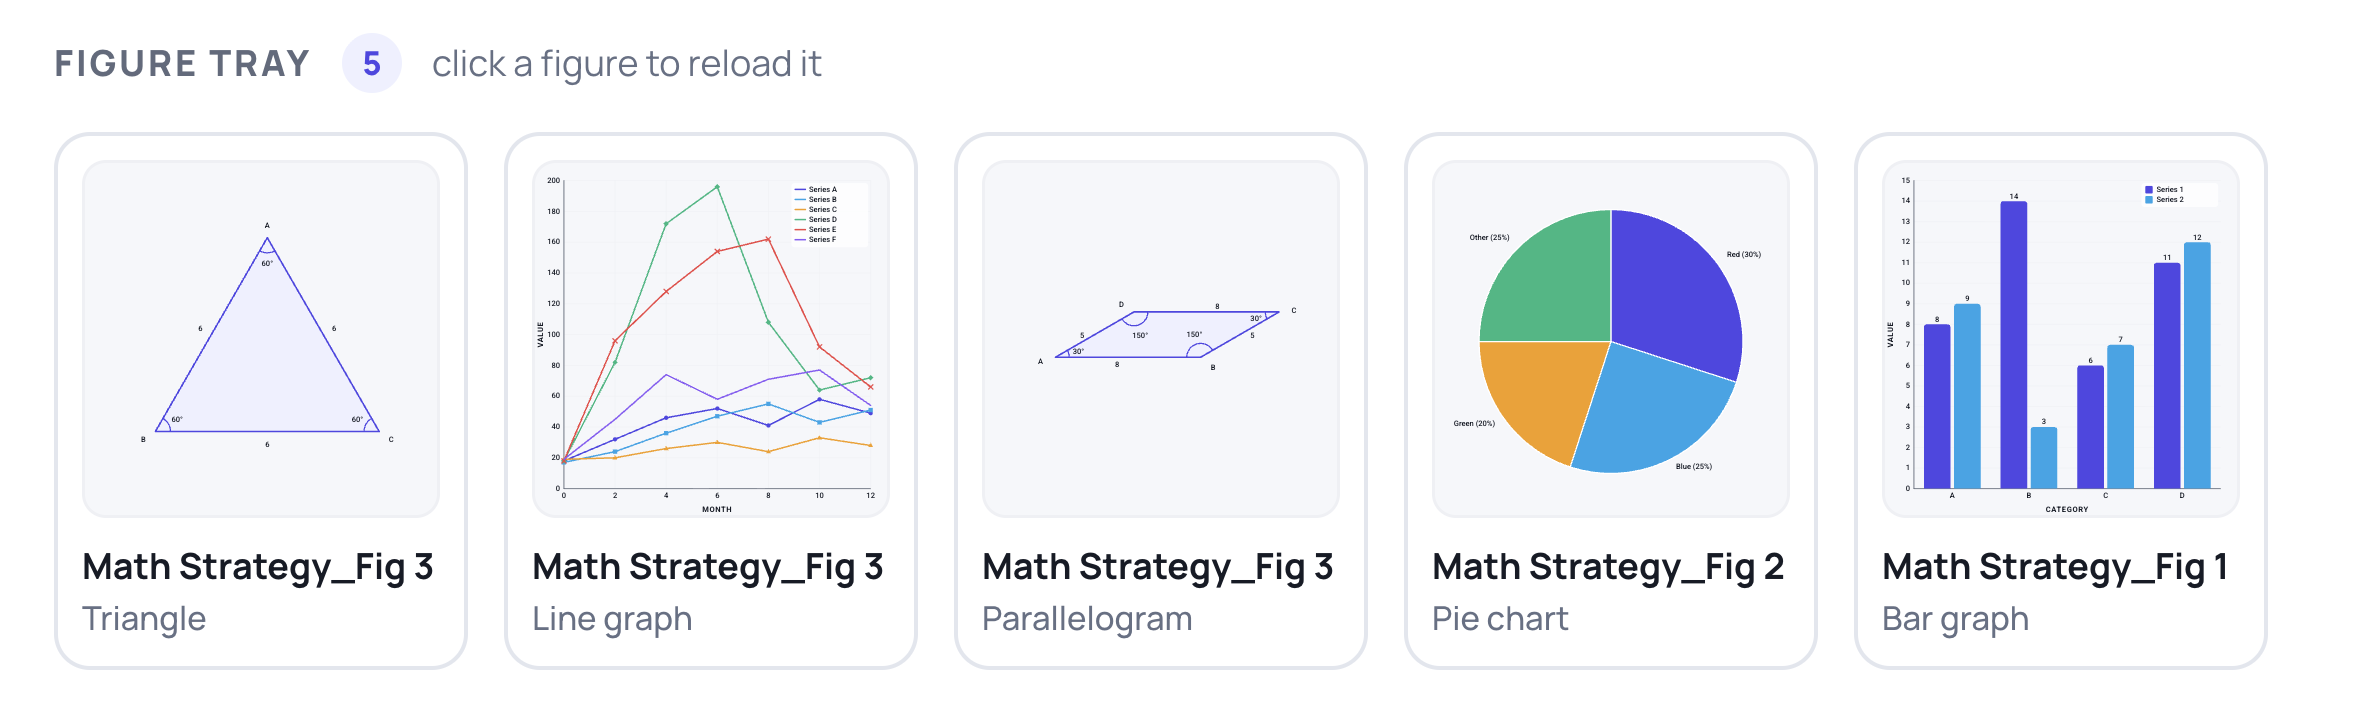
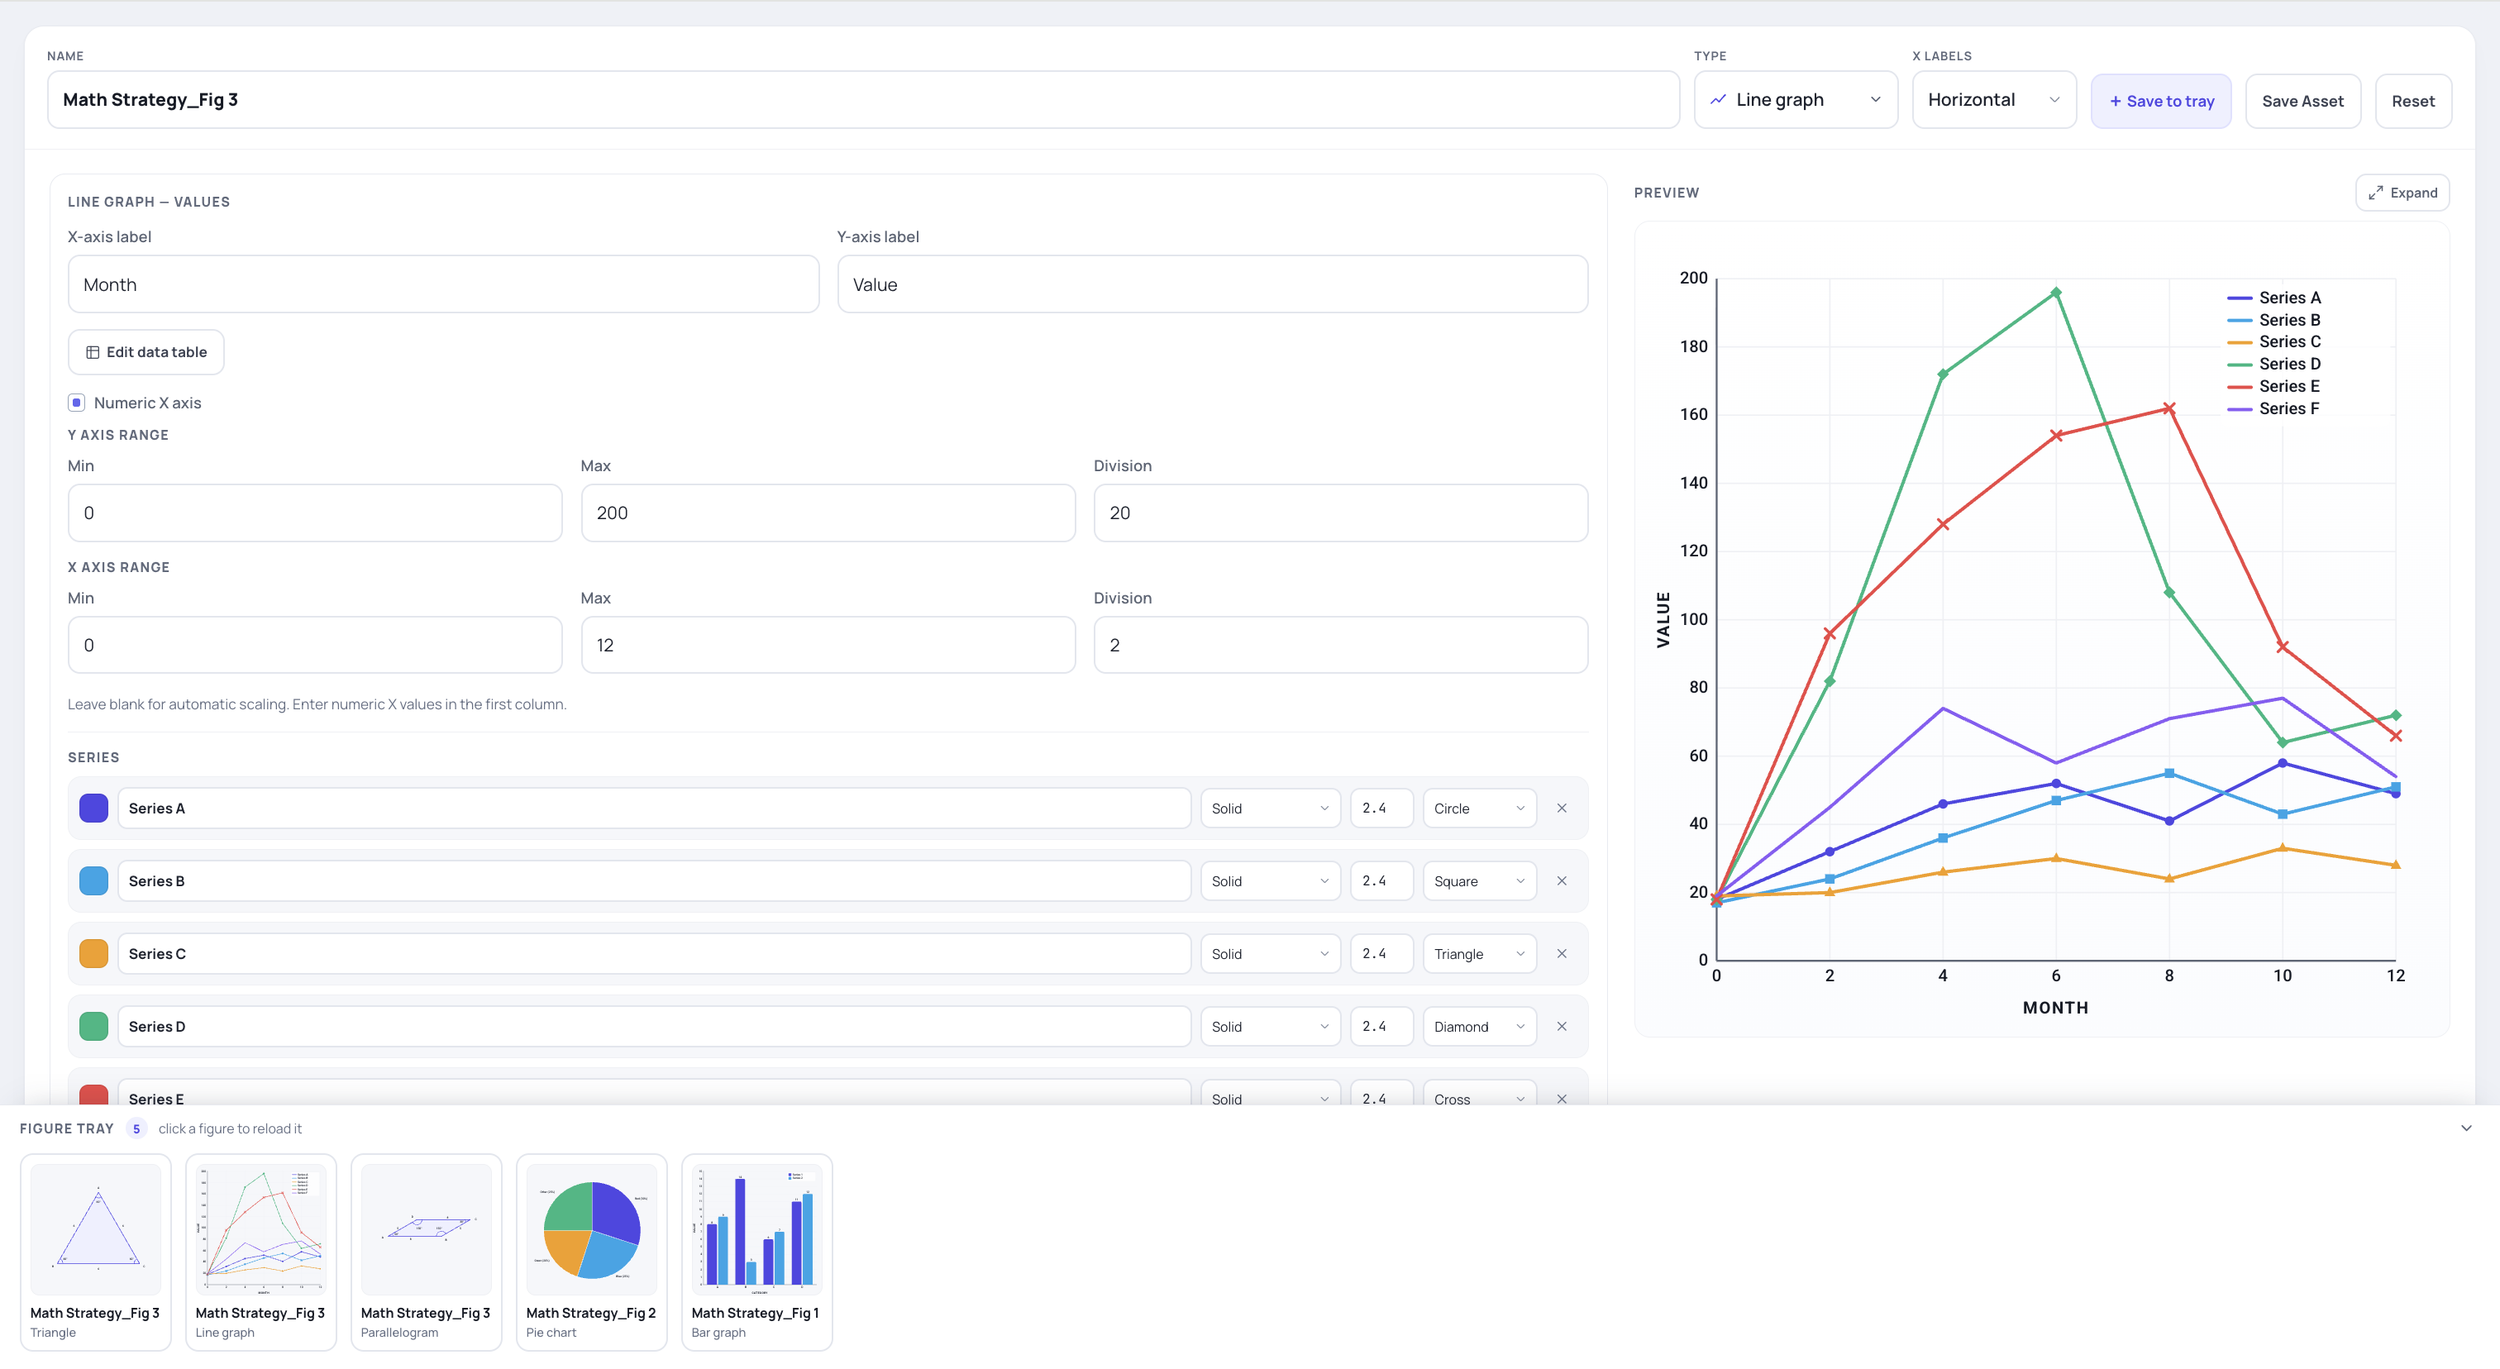
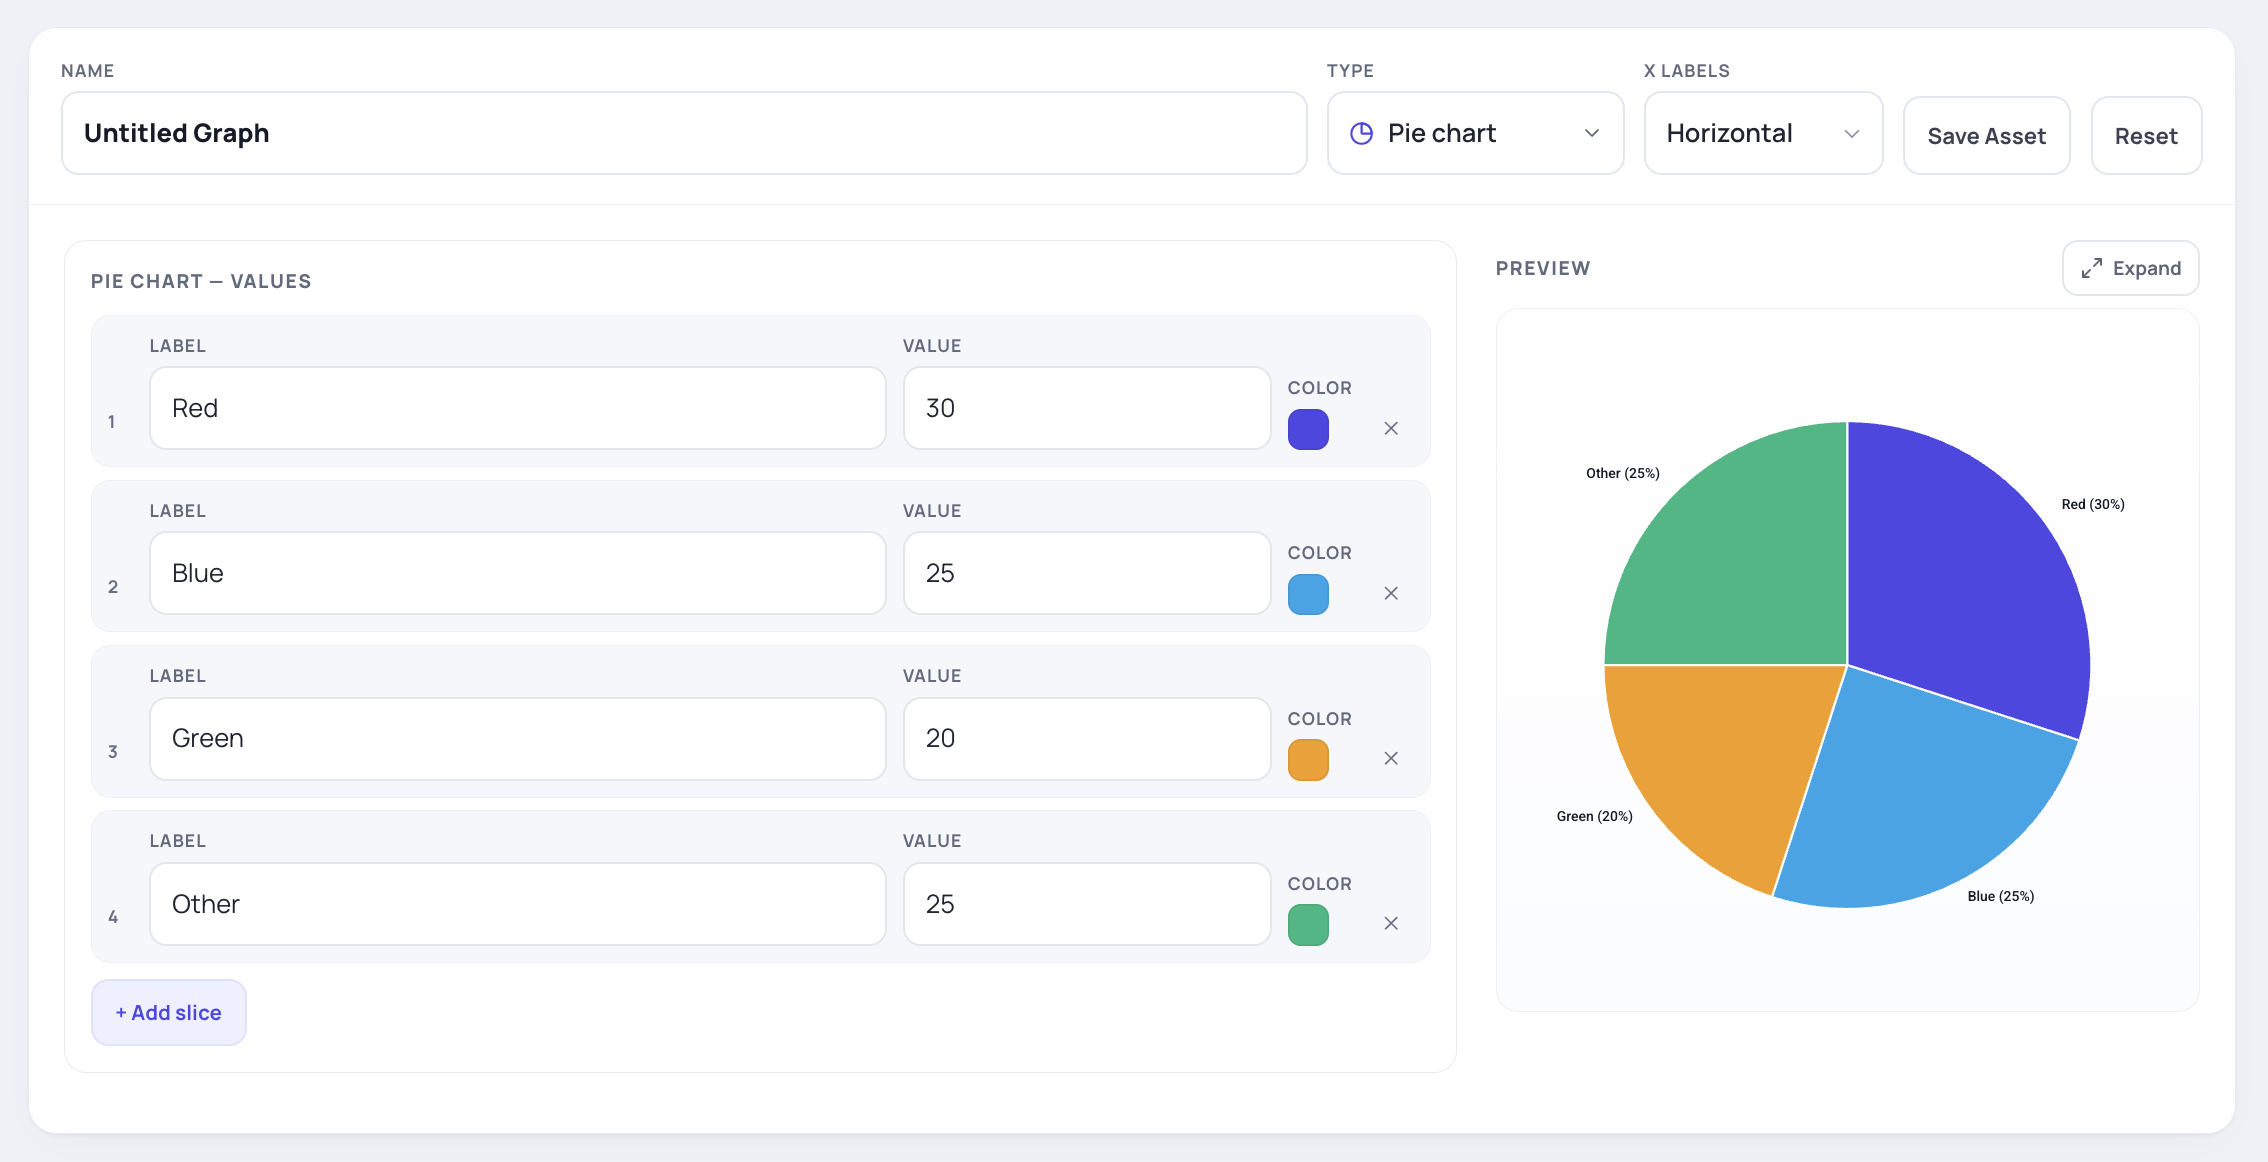
Design get hundred of figure request every week so it only made since a designer created it. I started with figure that took the most to create, line graphs, bar graphs, and scatter plots. These figure require the data points to accurlty reflect the correct placemnet so that students have a parllere learning expirence when taking ACT, PSAT, and EOC exams. Each componet reflects a figure designed in real time.
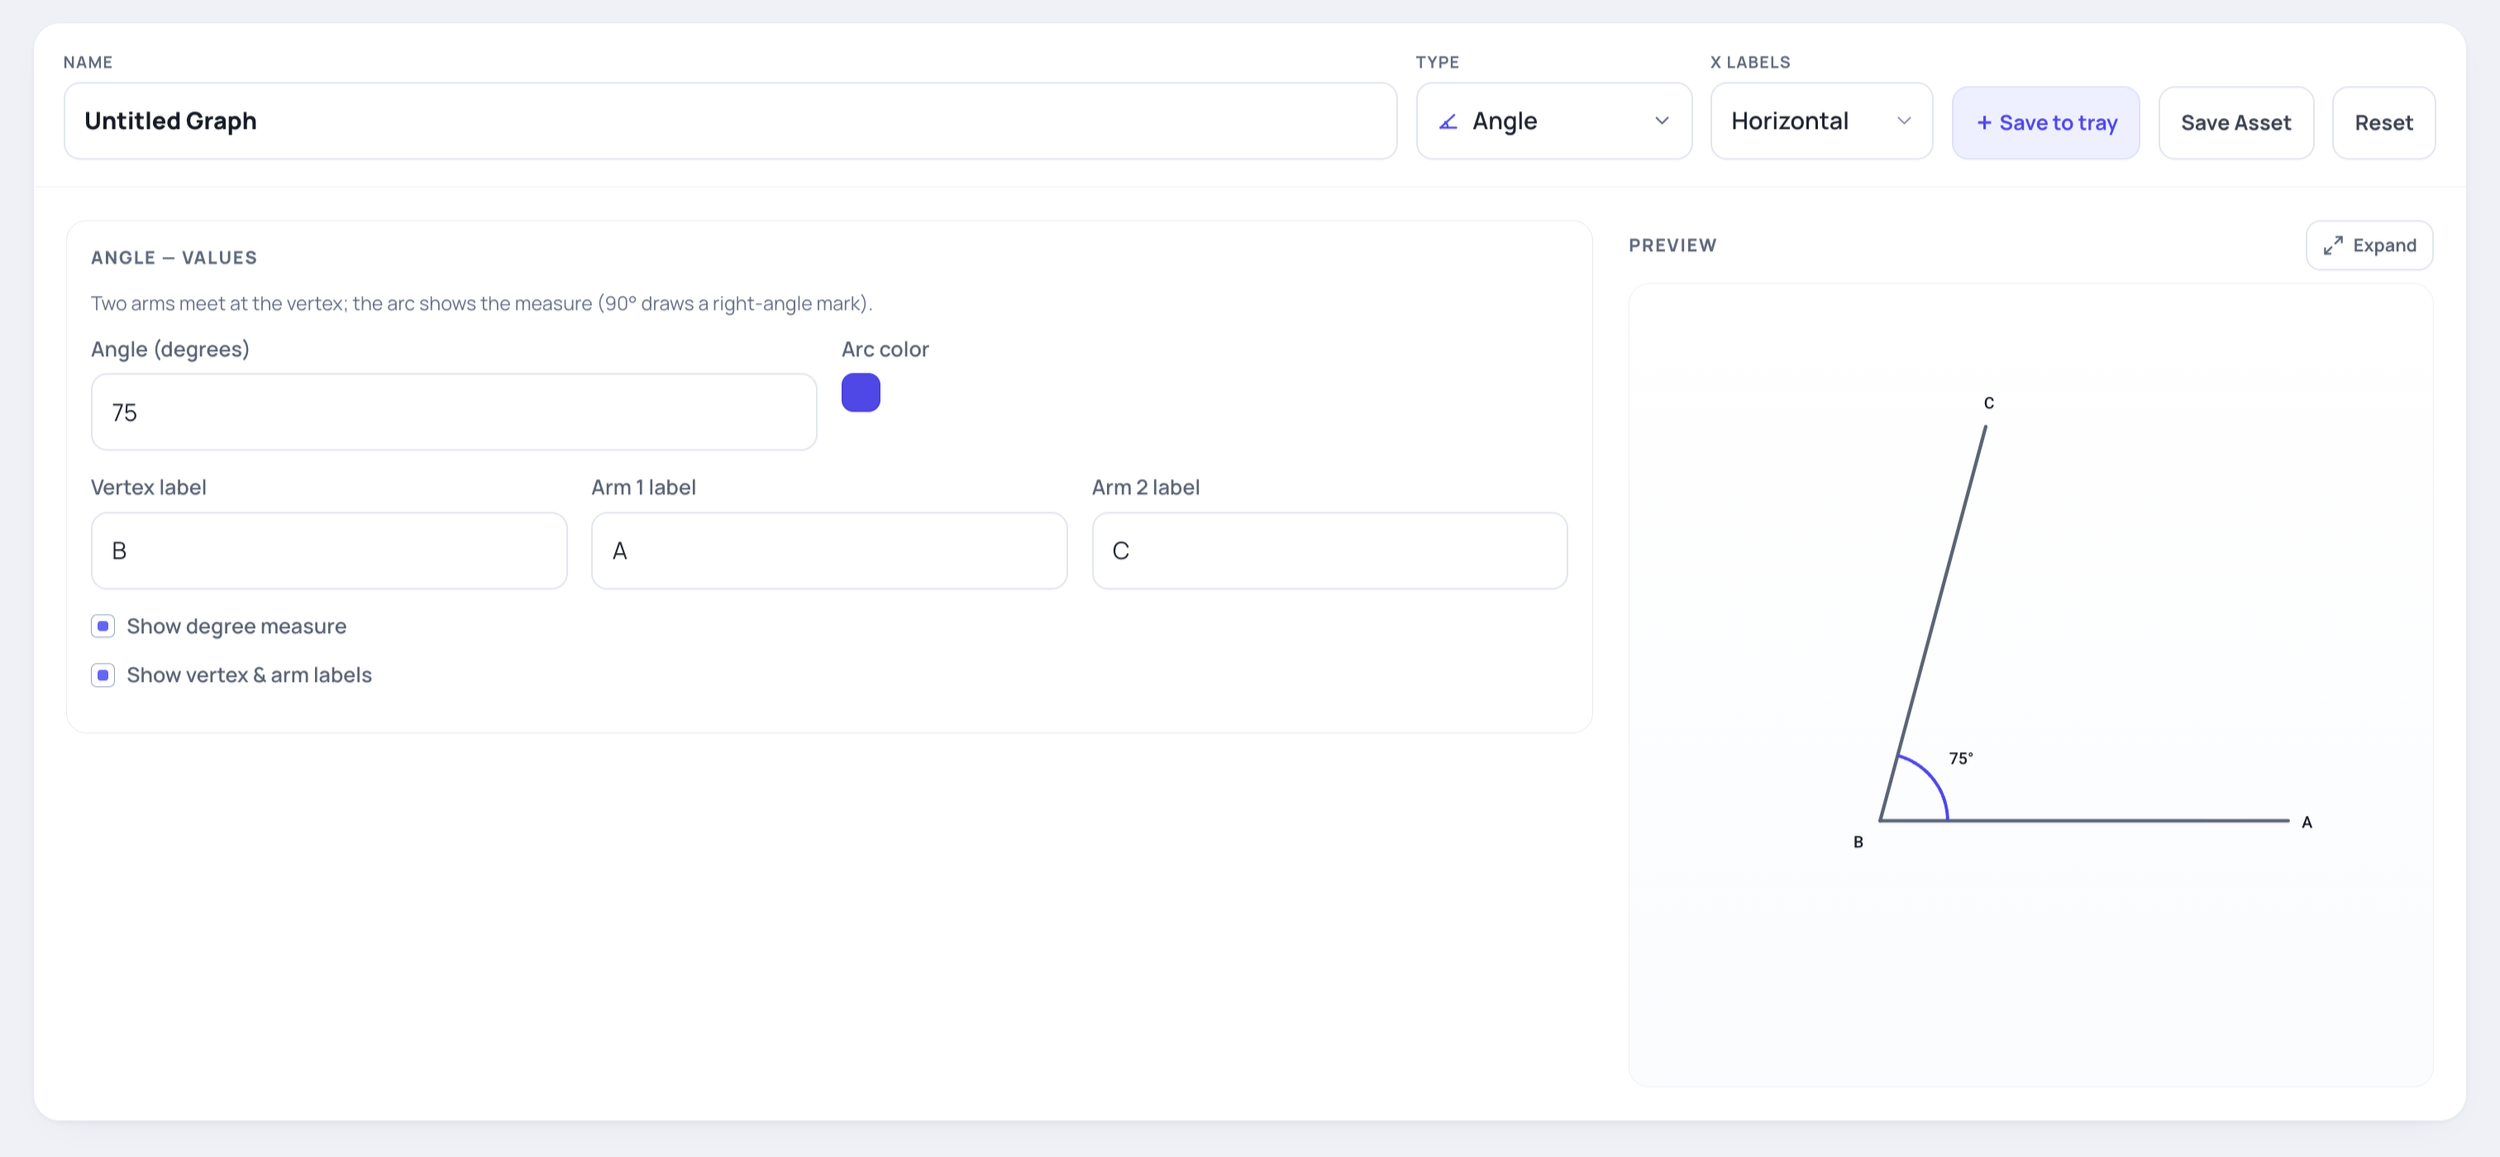
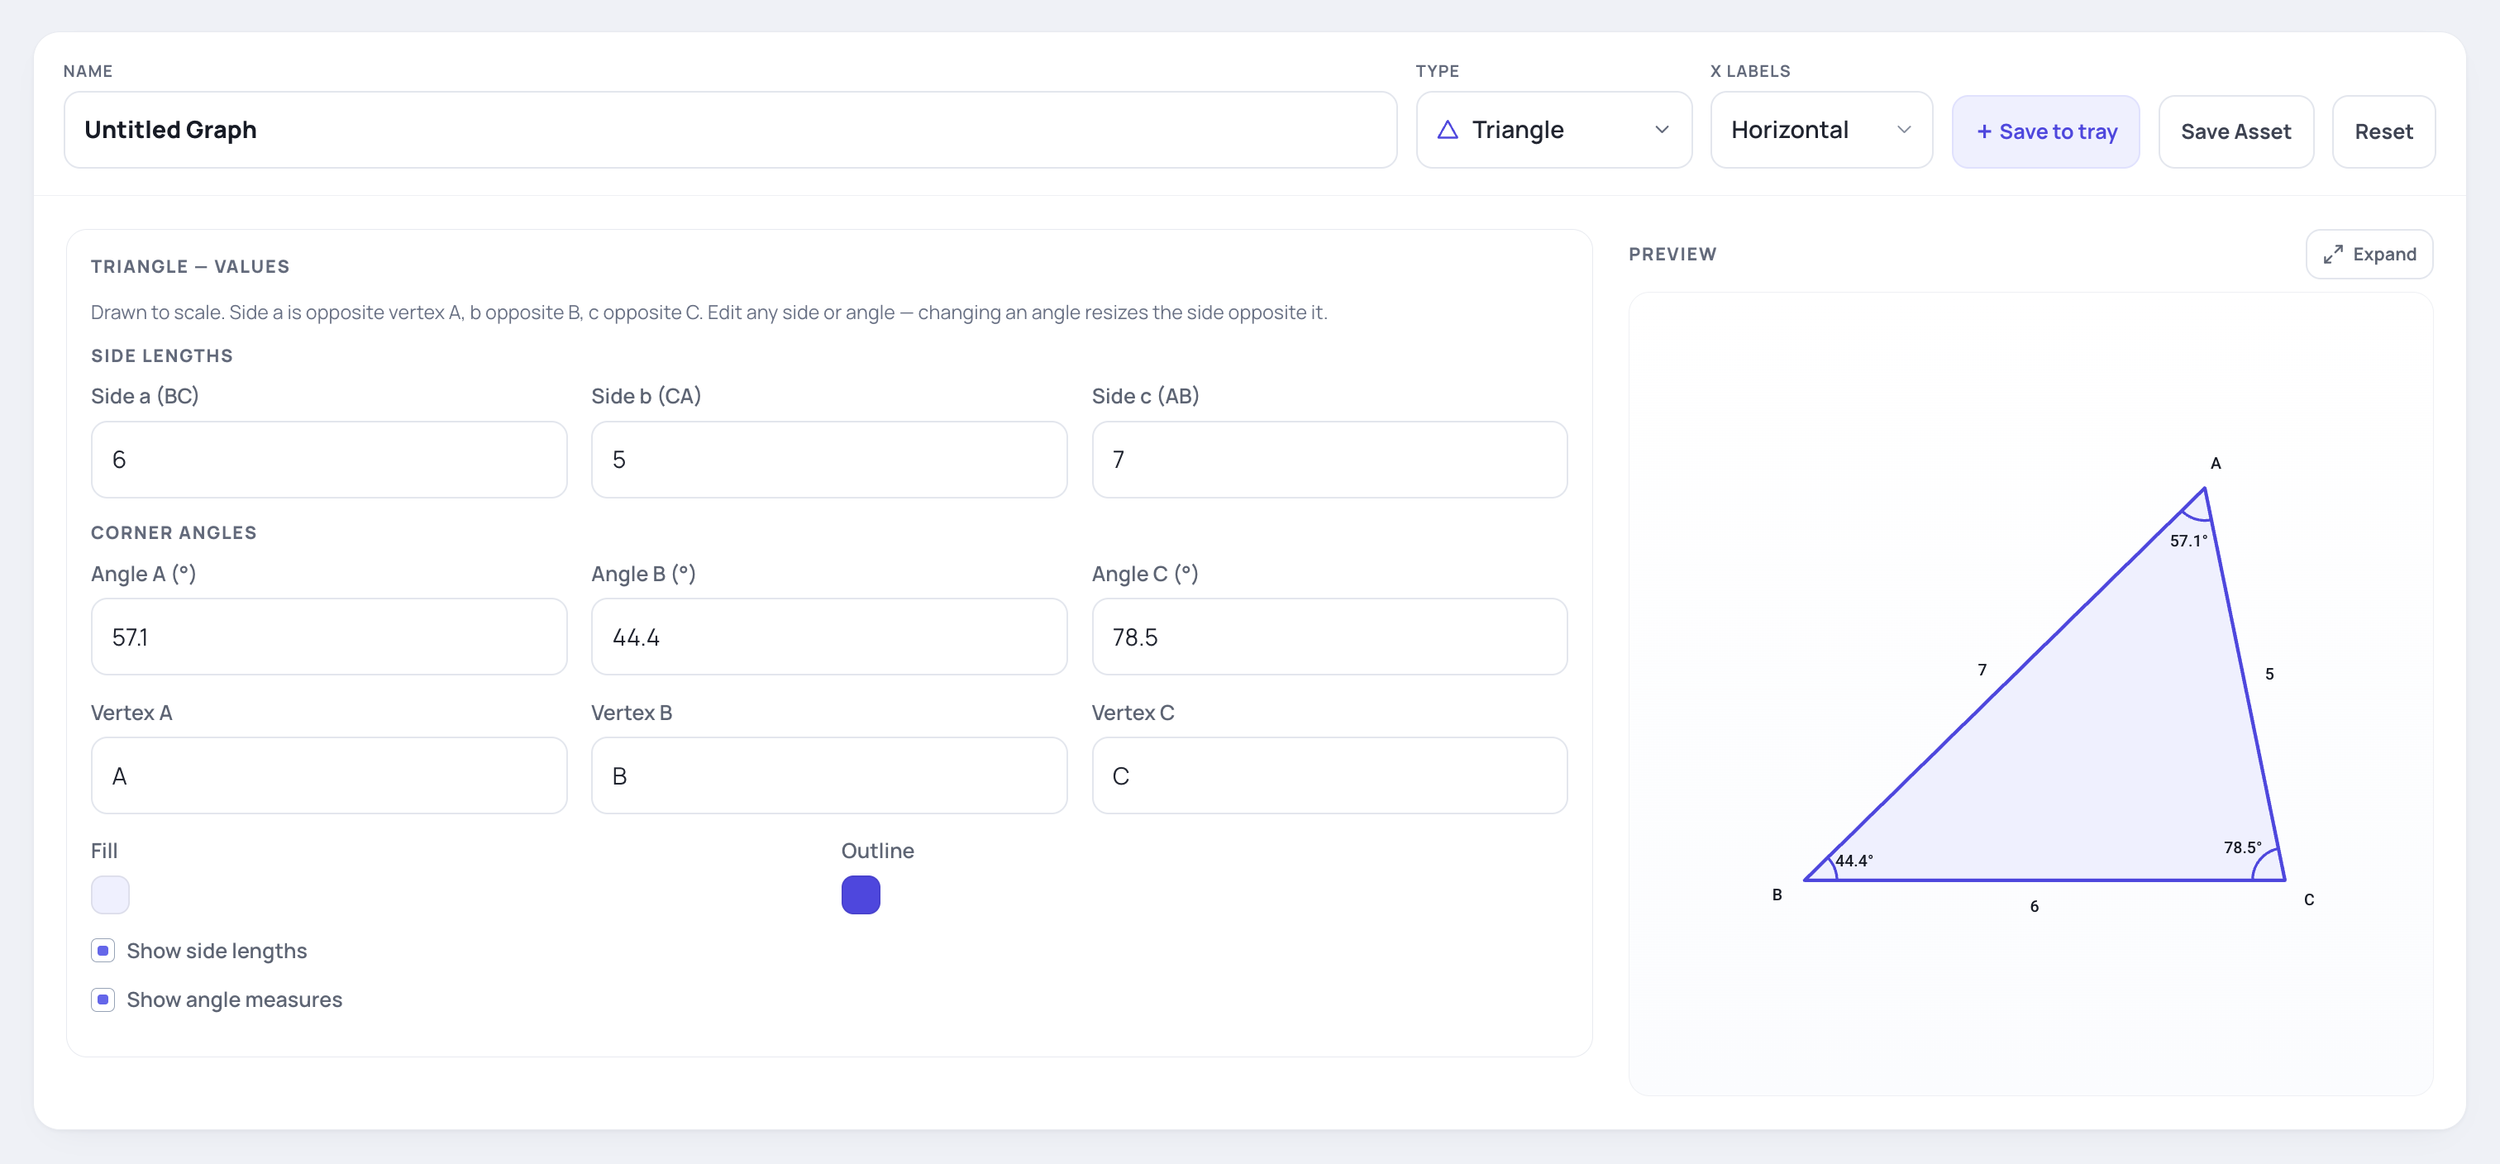
Getting the Angles right so students can actually messuer it.
SVG export capacity for syle changes.
Plotting Points made simple using a CSV file
Getting the Angles right so students can actually messuer it.
SVG export capacity for syle changes.
Buy In
Buy in took 2 months and once everyone liked it it took 8 weeks to offically deploy. Buy in took 2 months becasuse desing is consentil roating tasks, from figures to UI development to support other productm, buy in really caught traction when I used figures request to case study my tool I was building. While creating figures I was only building the tool for the next figure and production started moving faster.
5 choices that gave the tool leverage.
01
Editable SVG output
Crisp at any size, fully editable — design styles, not re-enters data.
02
Data in, figure out
Takes developers' data directly — no new format to learn.
03
Two clean roles
Many chart types
Content imports data; design exports and finishes. No overlap.
04
05
Built solo with AI
Supports the full range of math & science visuals
Crisp at any size, fully editable — design styles, not re-enters data.
Before
Copy-pasted CSV into Illustrator, then rebuilt the chart by hand. Third-party tools like Excel and GeoGebra got you a plot, never a finished figure. The expensive part was never the styling. It was making sure the math was right.
After
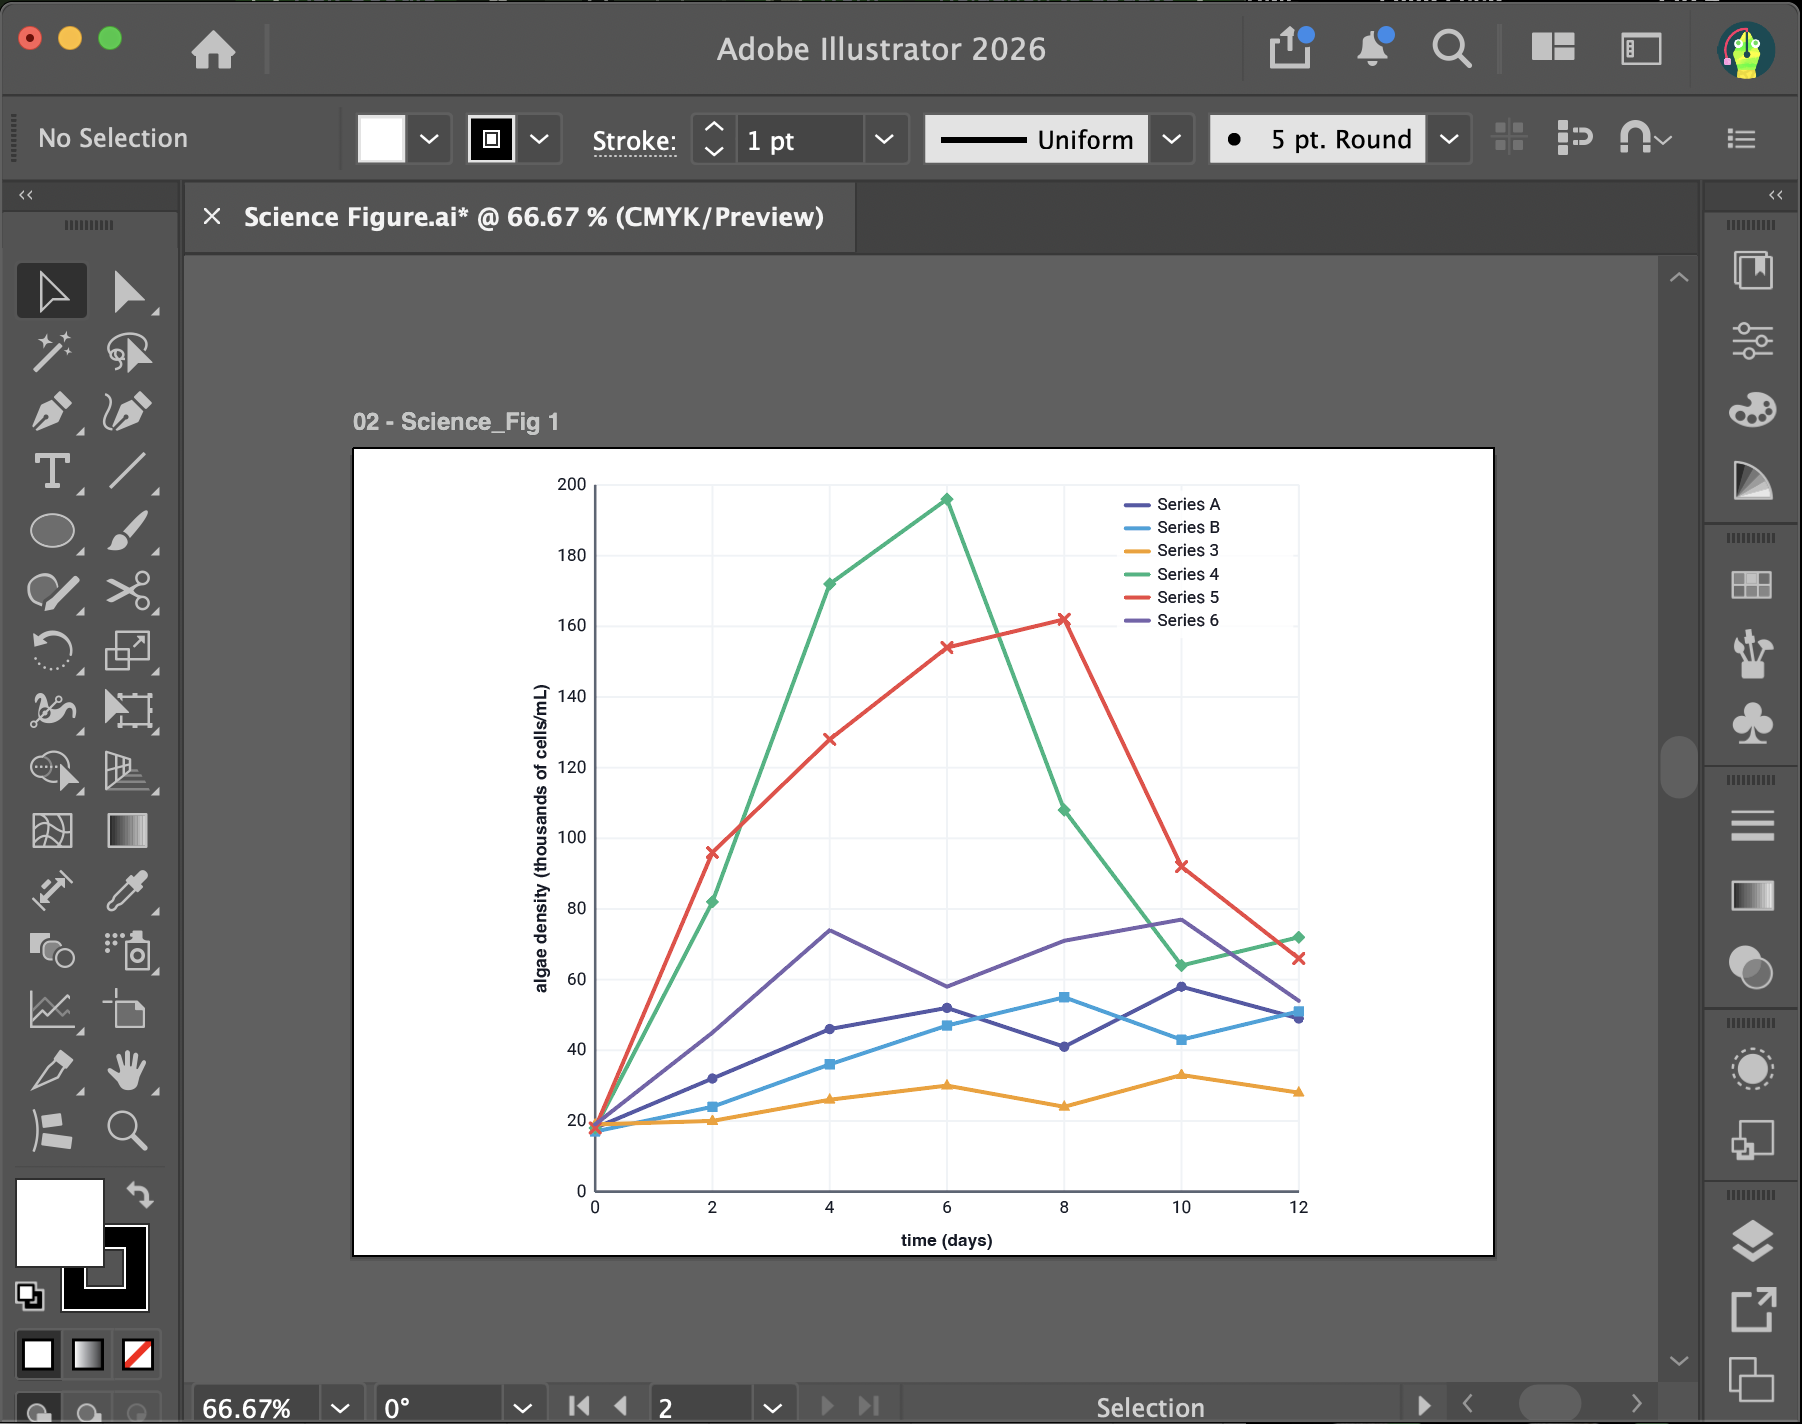
The same figure, imported as SVG from the tool. Data already correct, axes already labeled. What's left is style: matching state spec, house type, stroke weights. That's the part that needs a designer.

Shipped
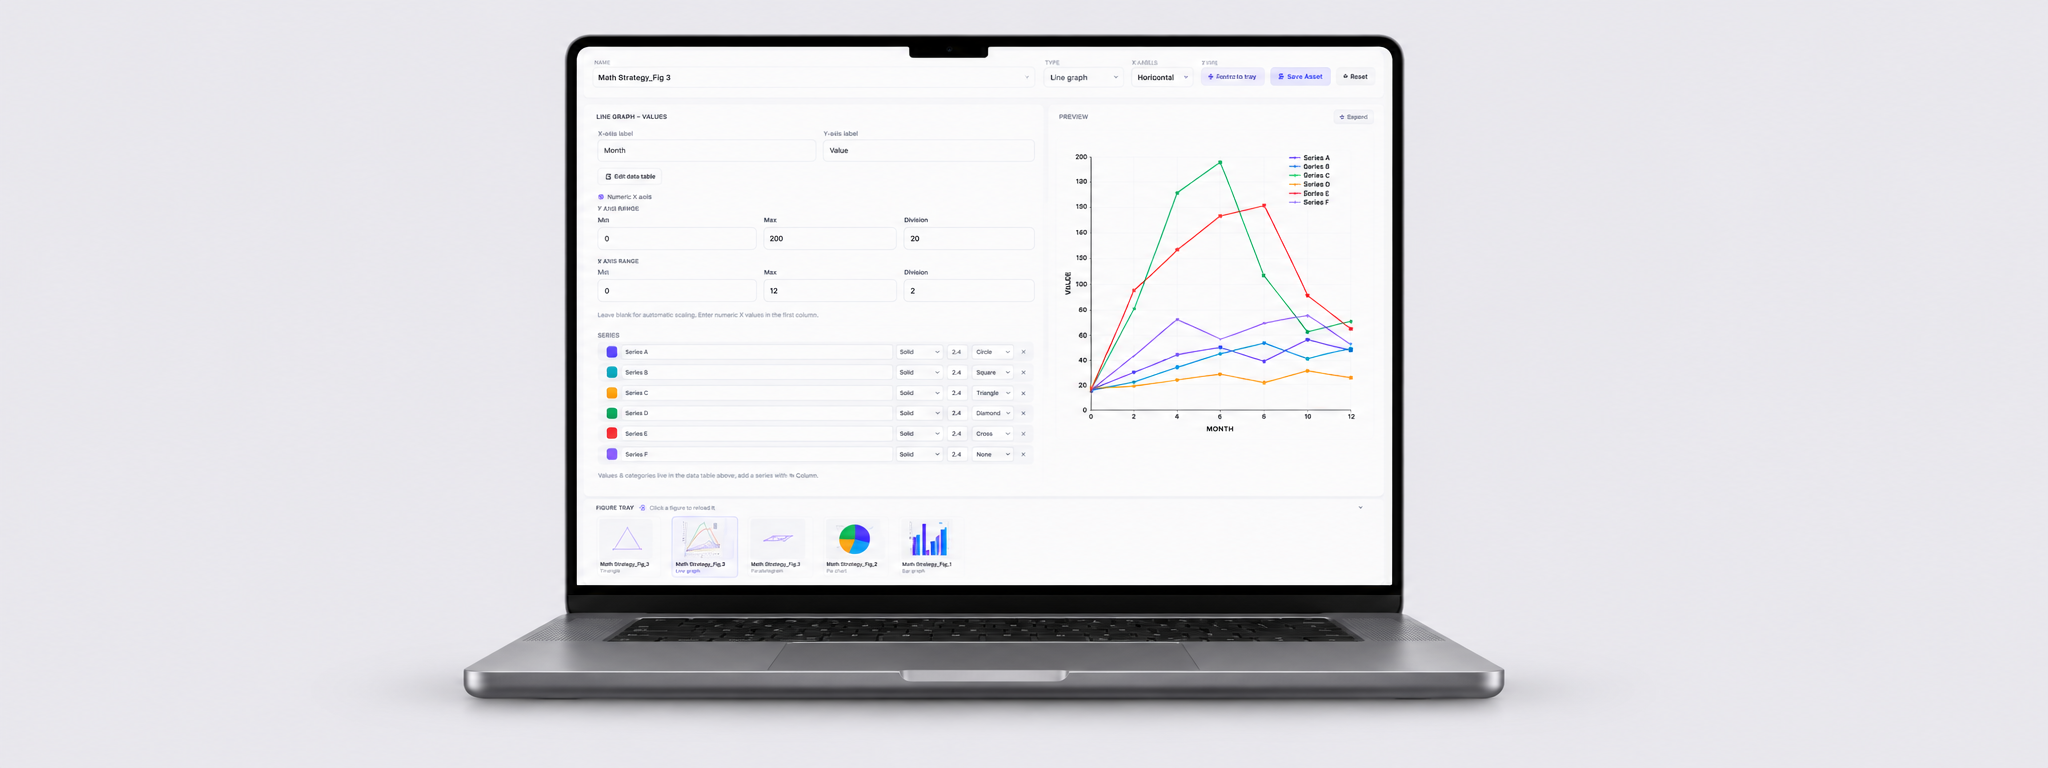
The work moved. Content developers plot and export their own figures, design finalizes style, and neither one waits on the other to start. For data-heavy math and science figures, that cut designer time roughly in half. The tool is live in the authoring platform and still shipping, with fixes coming in as tickets from the people using it.
1
✓
✓
✓
Screen unclogged the pipeline
Content developers plot and export their own figures. Design picks up work that's already accurate.
Design freed to design
Plotting moves upstream. Design starts with accurate data and spends its time on style.
Consistency by default
Figures come out to spec, not to an AI's guess.
Now in user-acceptance testing
Lives in the authoring platform, headed toward AI automation.

Reflection
When AI was woven into our work, designers started asking the same question: how do we get back autonomy and control over asset quality? Building this tool answered it for one part of the workflow. It also showed me I can do the whole arc, not just the design part. Name the problem, pitch it to stakeholders, build it, ship it.
This is one of several features I've developed in the LMS authoring platform. It's the one I chose to write up because it's a problem I was living in, and that's why I could see it clearly enough to fix.